The latest update for the Teams admin center includes the ability to manage the permissions used by third-party apps to access data via the Microsoft Graph. The updates also include the ability to manage resource specific consent (RSC) for Teams apps. While third-party apps ate the obvious target, LOB apps created by tenants are managed in the same way.
PowerShell hash tables are very efficient at retrieving data, which is just what’s needed when thousands of Office 365 accounts need processing. Our script to analyze usage data extracted from the Microsoft Graph was turbo-charged when we replaced list objects with hash tables, all of which makes it much easier to identify underused Office 365 accounts and save some money on licensing spend.
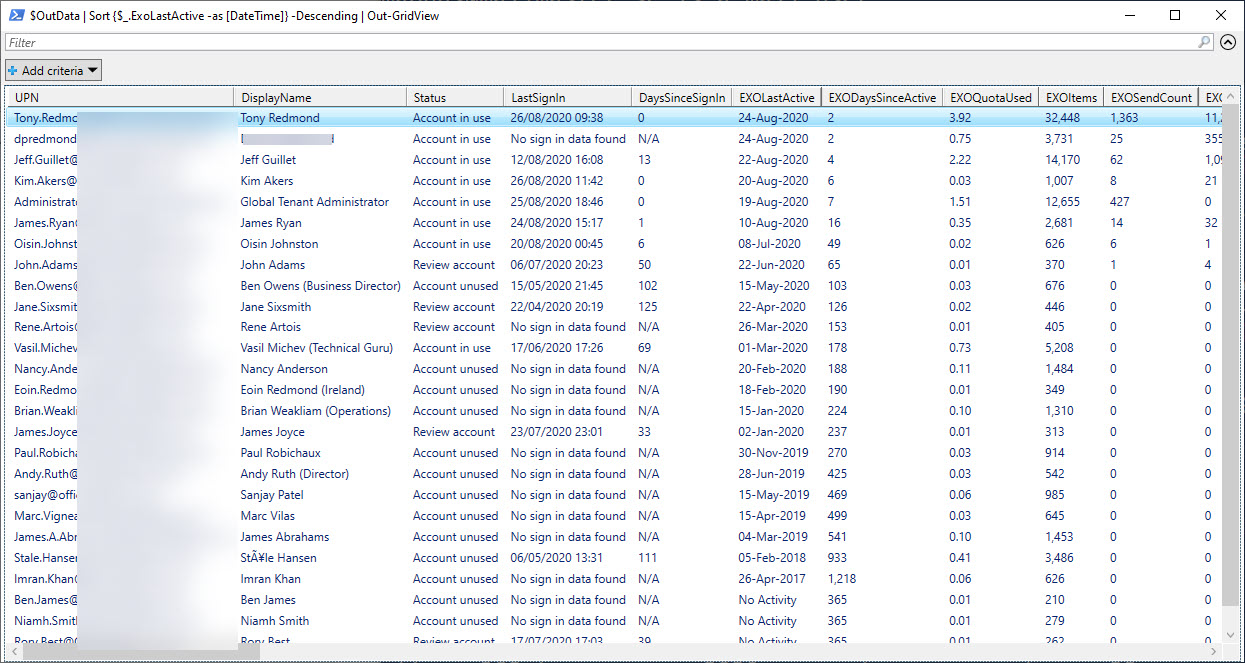
Office 365 usage data for several workloads is available through the Microsoft Graph. A PowerShell script is available to grab Graph data and use it to figure out if accounts are in active use. V1.2 of GetGraphUserStatisticsReport.PS1 is available in GitHub and should be better performing when processing thousands of accounts.
It’s easy to retrieve storage data for SharePoint Online sites with PowerShell, but it’s faster with the Graph. Some disadvantages do exist, but it’s nice to have a choice. TheGraph is faster, especially with large tenants, but the SharePoint Online PowerShell cmdlets can deliver more data.
Writing code to illustrate a point sometimes falls into the trap that things don’t work so well when you scale things up. Take Graph calls for instance. Code that works well with 100 teams isn’t so good with 4,000. The solution is to keep on telling the Graph to fetch data until it’s all in the safe hands of PowerShell, and then process it.
The Microsoft Graph gives programmers a RESTful interface to Office 365 data. Flow allows even non-programmers to automate tasks by combining building blocks of Office 365 data and actions. Put the two together and you can generate some impressive results. In this example, we combine Graph and Flow to create some nagging emails to admins to encourage them to improve the tenant’s Secure Score.
The Microsoft Graph developers and some other folks inside Microsoft have launched a new series of short blog posts to help people become acquainted with the Graph. It’s a nice idea, and one that’s worthwhile to read.